Download the latest Kennaook / Cape Grim Greenhouse Gas data (CSV)
Upper panel
Monthly mean baseline greenhouse gas concentrations measured at the Kennaook / Cape Grim Baseline Air Pollution Station, Tasmania.
Lower panel
Annual (blue bars) and decadal (red horizontal lines) growth rates of greenhouse gases in the atmosphere.
Baseline
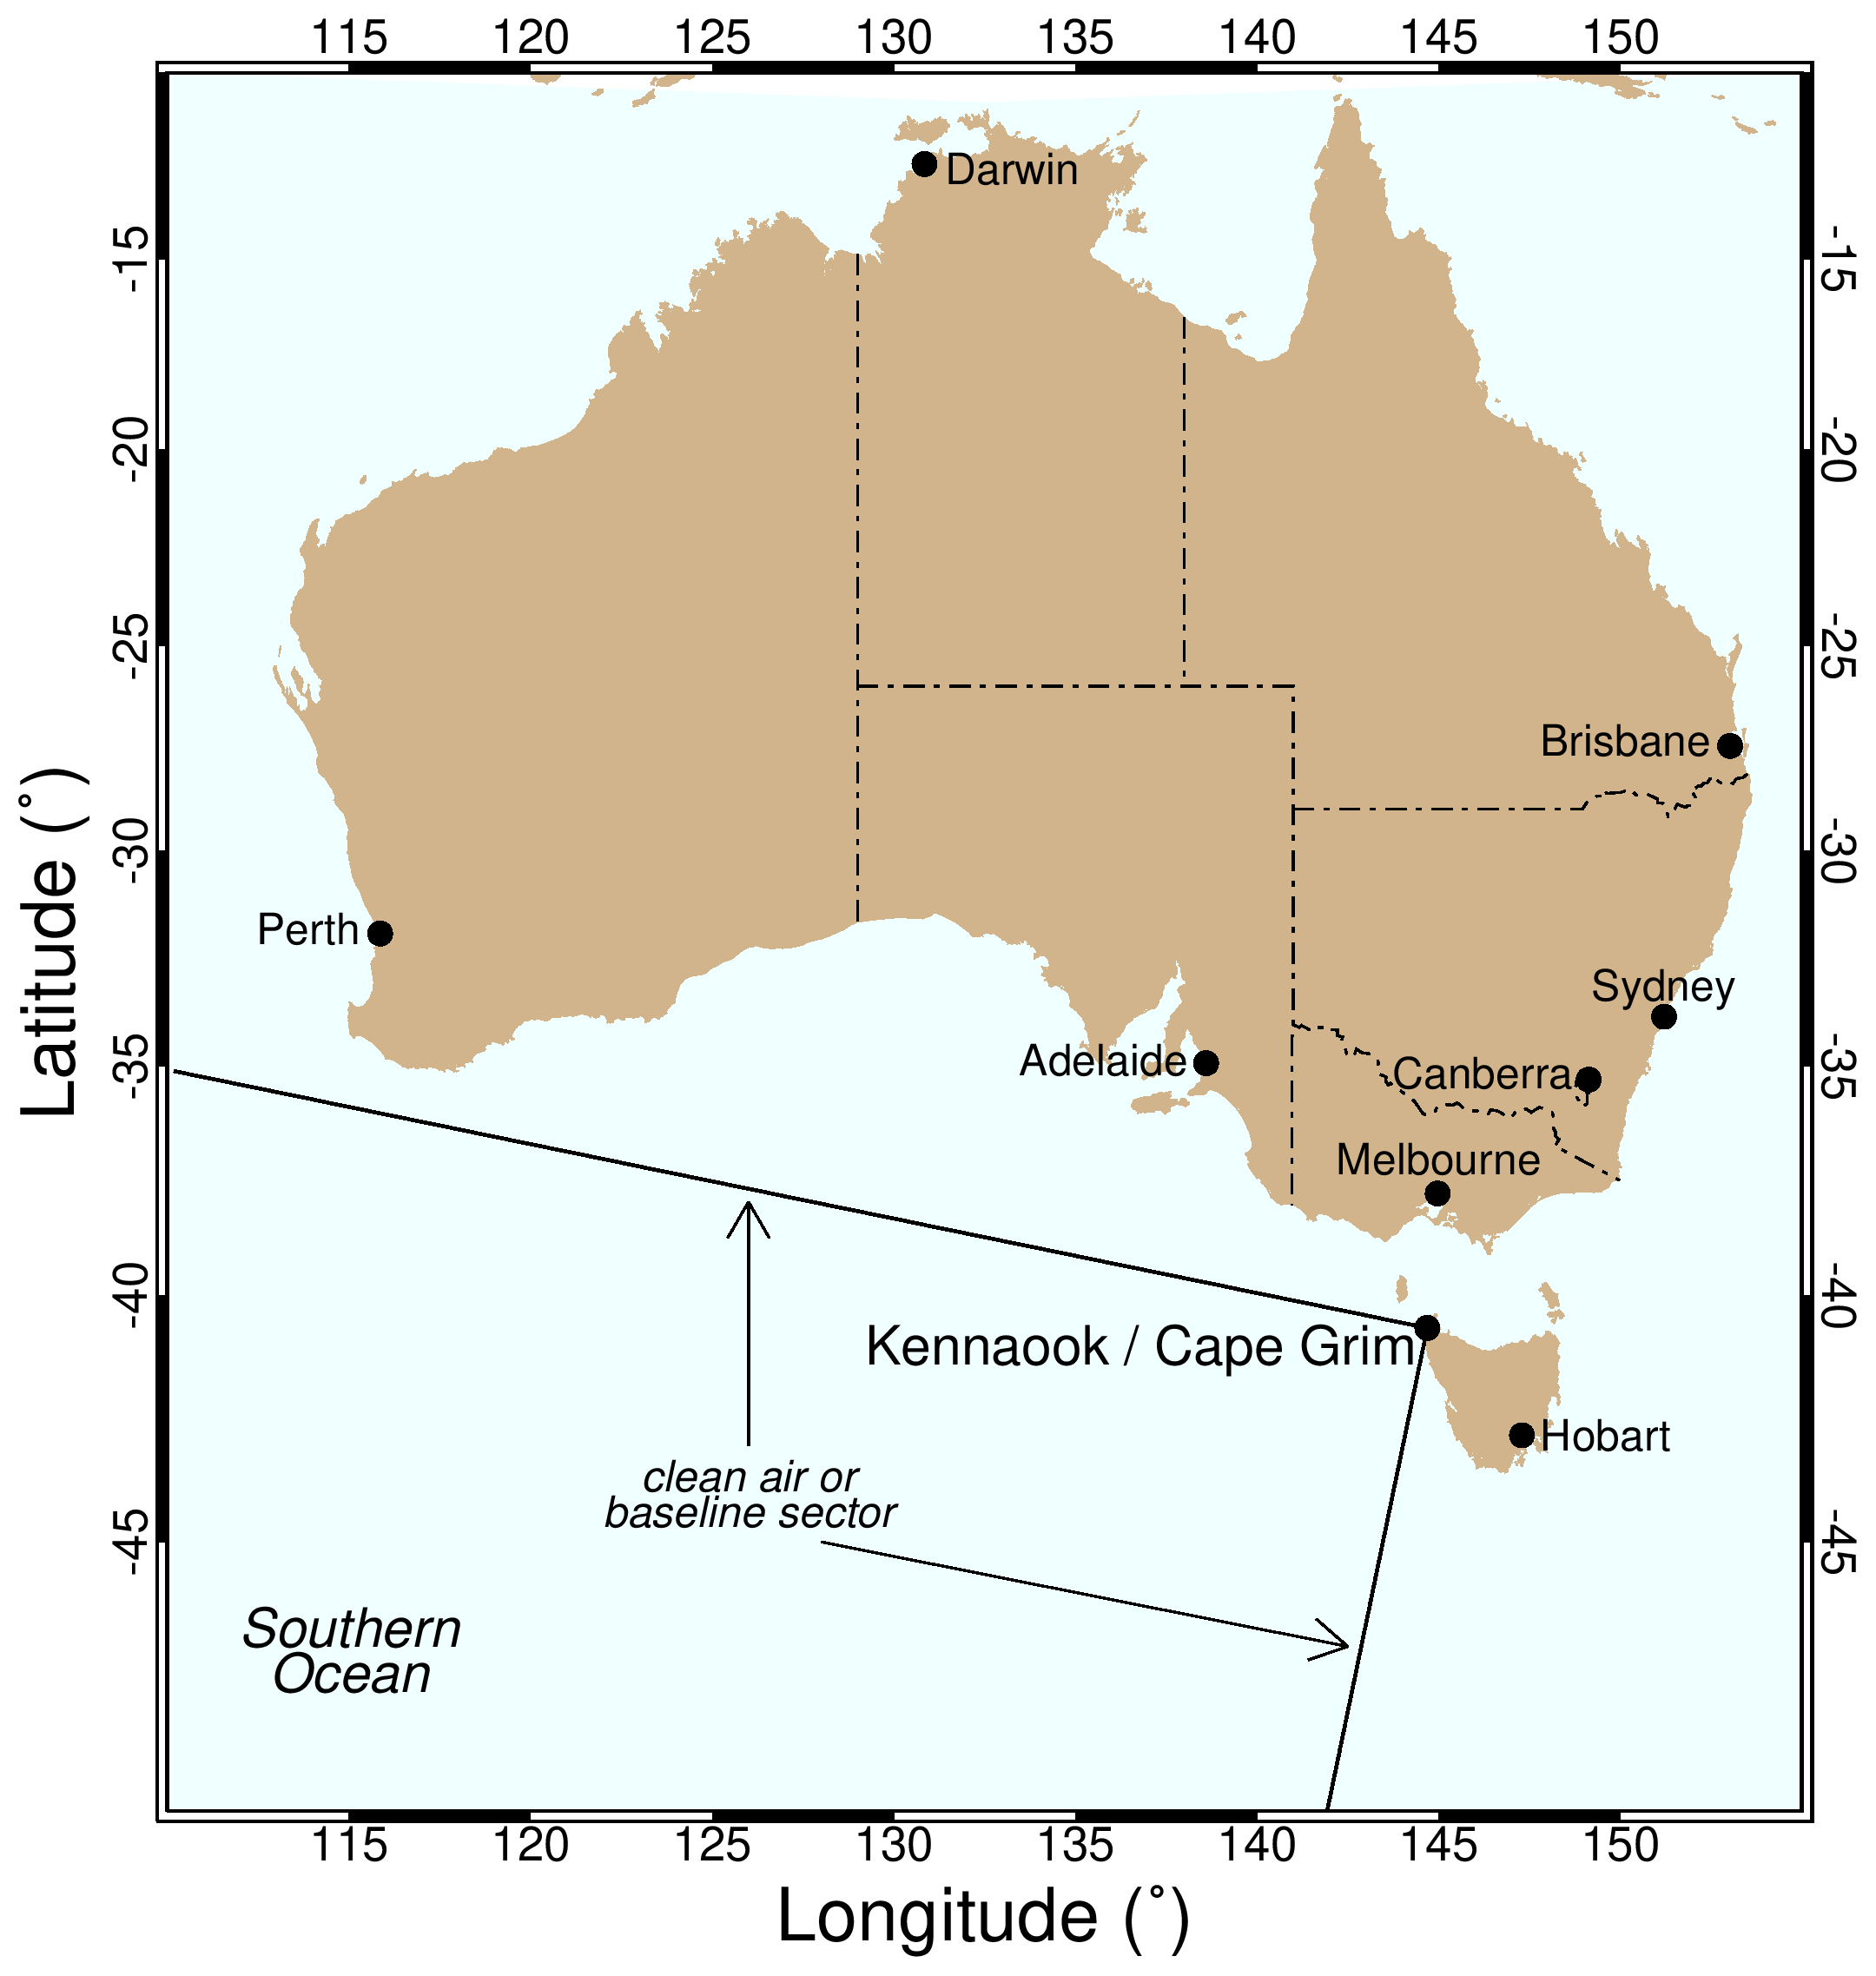 In the map below, the clean air or 'baseline' sector for Kennaook / Cape Grim is shown. Air masses arriving at the Kennaook / Cape Grim station from between 190-280 degrees have typically travelled for many thousands of kilometres across the Southern Ocean. This air is free from recent human and terrestrial influences and is very well mixed, meaning it represents the background or 'baseline' atmospheric composition for the mid-latitudes of the Southern Hemisphere. The long-term changes in baseline atmospheric composition are the principal drivers of climate change.
Not all air arriving at Kennaook / Cape Grim comes from the baseline sector. Other wind directions bring air masses that carry the signals from the land surface and human emissions, from cities, agriculture, and other activities.
The data provided here are the baseline data measured at Kennaook / Cape Grim, showing the underlying, and ubiquitous changes occurring in the composition of the atmosphere. Monthly mean data are determined from a smooth curve fit to all the baseline hours measured in a month. Annual mean growth rates of greenhouse gas concentration (ppm/year or ppb/year) are determined by first calculating an annual mean growth rate centred on each month. For example, the annual growth rate centred on January in year n, GR(Jann) is given by the Jul(n–1) – Jul(n) monthly mean concentrations; GR(Febn) = Aug((n–1) – Aug(n) … GR(Juln) = Jan(n) – Jan(n+1) … GR(Decn) = Jun(n) – Jun(n+1). Finally, the mean of those twelve growth rate values is reported for each year as the annual mean growth rate. Decadal means are calculated from the annual means for each decade.
History
In 1798, the steep, forbidding, black rocks forming the north-west cape of Tasmania led Matthew Flinders to name the location Cape Grim, as he circumnavigated the island. However, long before Flinders bestowed his European name, the Peerapper people called the area Kennaook. We now call the observatory Kennaook / Cape Grim Baseline Air Pollution Station.
The Kennaook / Cape Grim program originated from a commitment by the Australian Government to the United Nations Environment Program in the early 1970s to monitor and study global atmospheric composition for climate change purposes. As a result, the Kennaook / Cape Grim Baseline Air Pollution Station (KCG BAPS) first began measuring the composition of the atmosphere in April 1976 and has been in continuous operation since that date.
Kennaook / Cape Grim is a joint responsibility of the Bureau of Meteorology (BoM) and the Commonwealth Scientific and Industrial Research Organisation (CSIRO). The BoM funds and operates the CG BAPS. CSIRO is responsible for the quality of the data and provides analysis, interpretation and modelling of the results. All data are made available to interested parties – Australian government agencies, industry, the public and international agencies.
Kennaook / Cape Grim data are more valuable than ever in understanding how our atmosphere is changing, as we track progress towards the goals of the Paris Agreement.
What is measured?
The composition of the air arriving at Kennaook / Cape Grim is analysed to determine concentrations of more than 80 different greenhouse gases (GHGs), including carbon dioxide (CO2), methane (CH4), nitrous oxide (N2O) and synthetic GHGs such as hydrofluorocarbons (HFCs), perfluorocarbons (PFCs) and sulfur hexafluoride (SF6). Many of the most potent GHGs are also ozone depleting substances (such as the chlorofluorocarbons (CFCs) and halons).
Air pollutants including natural and anthropogenic aerosols (particles such as sea salt, mineral dust and black carbon) and reactive gases are also measured along with weather and climate indicators like wind speed and direction, rainfall, temperature, humidity and solar radiation.
The Australian Nuclear Science and Technology Organisation (ANSTO) also contributes to the atmospheric composition program, measuring the naturally occurring radioactive gas 222Radon.
| Formula/Acronym | Gases |
|---|---|
| CO2 | carbon dioxide |
| CH4 | methane |
| N2O | nitrous oxide |
| CFC | chlorofluorocarbon |
| HFC | hydrofluorocarbon |
| PFC | perfluorocarbon |
| SF6 | sulfur hexafluoride |
| ODS | ozone depleting substances |
| GHG | greenhouse gas |
Some of the air samples collected at Kennaook / Cape Grim have been archived for further analyses as required. The Cape Grim Air Archive commenced in 1978 and is invaluable in determining the past atmospheric composition of a wide range of gases. For some of these gases, accurate and precise analytical methods have only recently evolved (for example HFCs and PFCs).
The measurements are state-of-the-art in precision and accuracy. They are used to identify trace gas trends in the Southern Hemisphere, which in turn can be used to drive climate change models. They are also helping to identify processes that influence further atmospheric composition change, and predict how the climate will change under different scenarios of future GHG loading.
Changes in the air
Most GHGs (for example carbon dioxide, nitrous oxide, HFCs, PFCs, sulfur hexafluoride) have shown continuous increases in concentration since the mid-to-late 1970s. However, those GHGs which are also ozone depleting substances such as the CFCs are now in decline. This is owing to a ban on their production under the Montreal Protocol that was developed to protect the stratospheric ozone layer.
Since the station first began measurements in 1976, carbon dioxide levels have increased by almost 25 per cent.
Concentrations of methane and nitrous oxide at Cape Grim have also increased significantly since 1978 by about 24 and 10 per cent respectively.
These increases are principally caused by human activities such as fossil fuel consumption and various agricultural practices.
Carbon dioxide
Measurement
Carbon dioxide concentrations in air masses have been measured using a technique called cavity ring-down spectroscopy (CRDS) since 2013. These instruments can detect the concentration of carbon dioxide by measuring the amount infrared laser light absorbed by an air sample compared to a reference or calibration air sample.
Prior to 2013, Non-Dispersive Infrared (NDIR) gas analysers were used to measure carbon dioxide. These instruments operate in a similar way to the more modern CRDS instruments, but require more onerous calibration regimes to account for drift and non-linearity.
Carbon dioxide can also be measured using a gas chromatograph (GC), by first converting the carbon dioxide to methane, and then measuring the methane with a flame ionisation detector (FID) (see below).
Seasonal variation
Carbon dioxide concentrations show seasonal variations (annual cycles) that vary according to global location and altitude. Several processes contribute to carbon dioxide annual cycles: for example, uptake and release of carbon dioxide by terrestrial plants and the oceans, and the transport of carbon dioxide around the globe from source regions (the Northern Hemisphere is a net source of carbon dioxide, the Southern Hemisphere a net sink).
The Kennaook / Cape Grim baseline carbon dioxide data displayed show both the annual cycle and the long-term trend.
Inter-annual variability
As well as the obvious seasonal variations and long-term trends in carbon dioxide concentrations, there are also more subtle variations, which have been shown to correlate significantly with the regular El Niño-Southern Oscillation (ENSO) phenomenon and with major volcanic eruptions. These variations in carbon dioxide are small compared to the regular annual cycle, but can make a difference to the observed year-by-year increase in carbon dioxide.
Comparison to pre-industrial concentrations
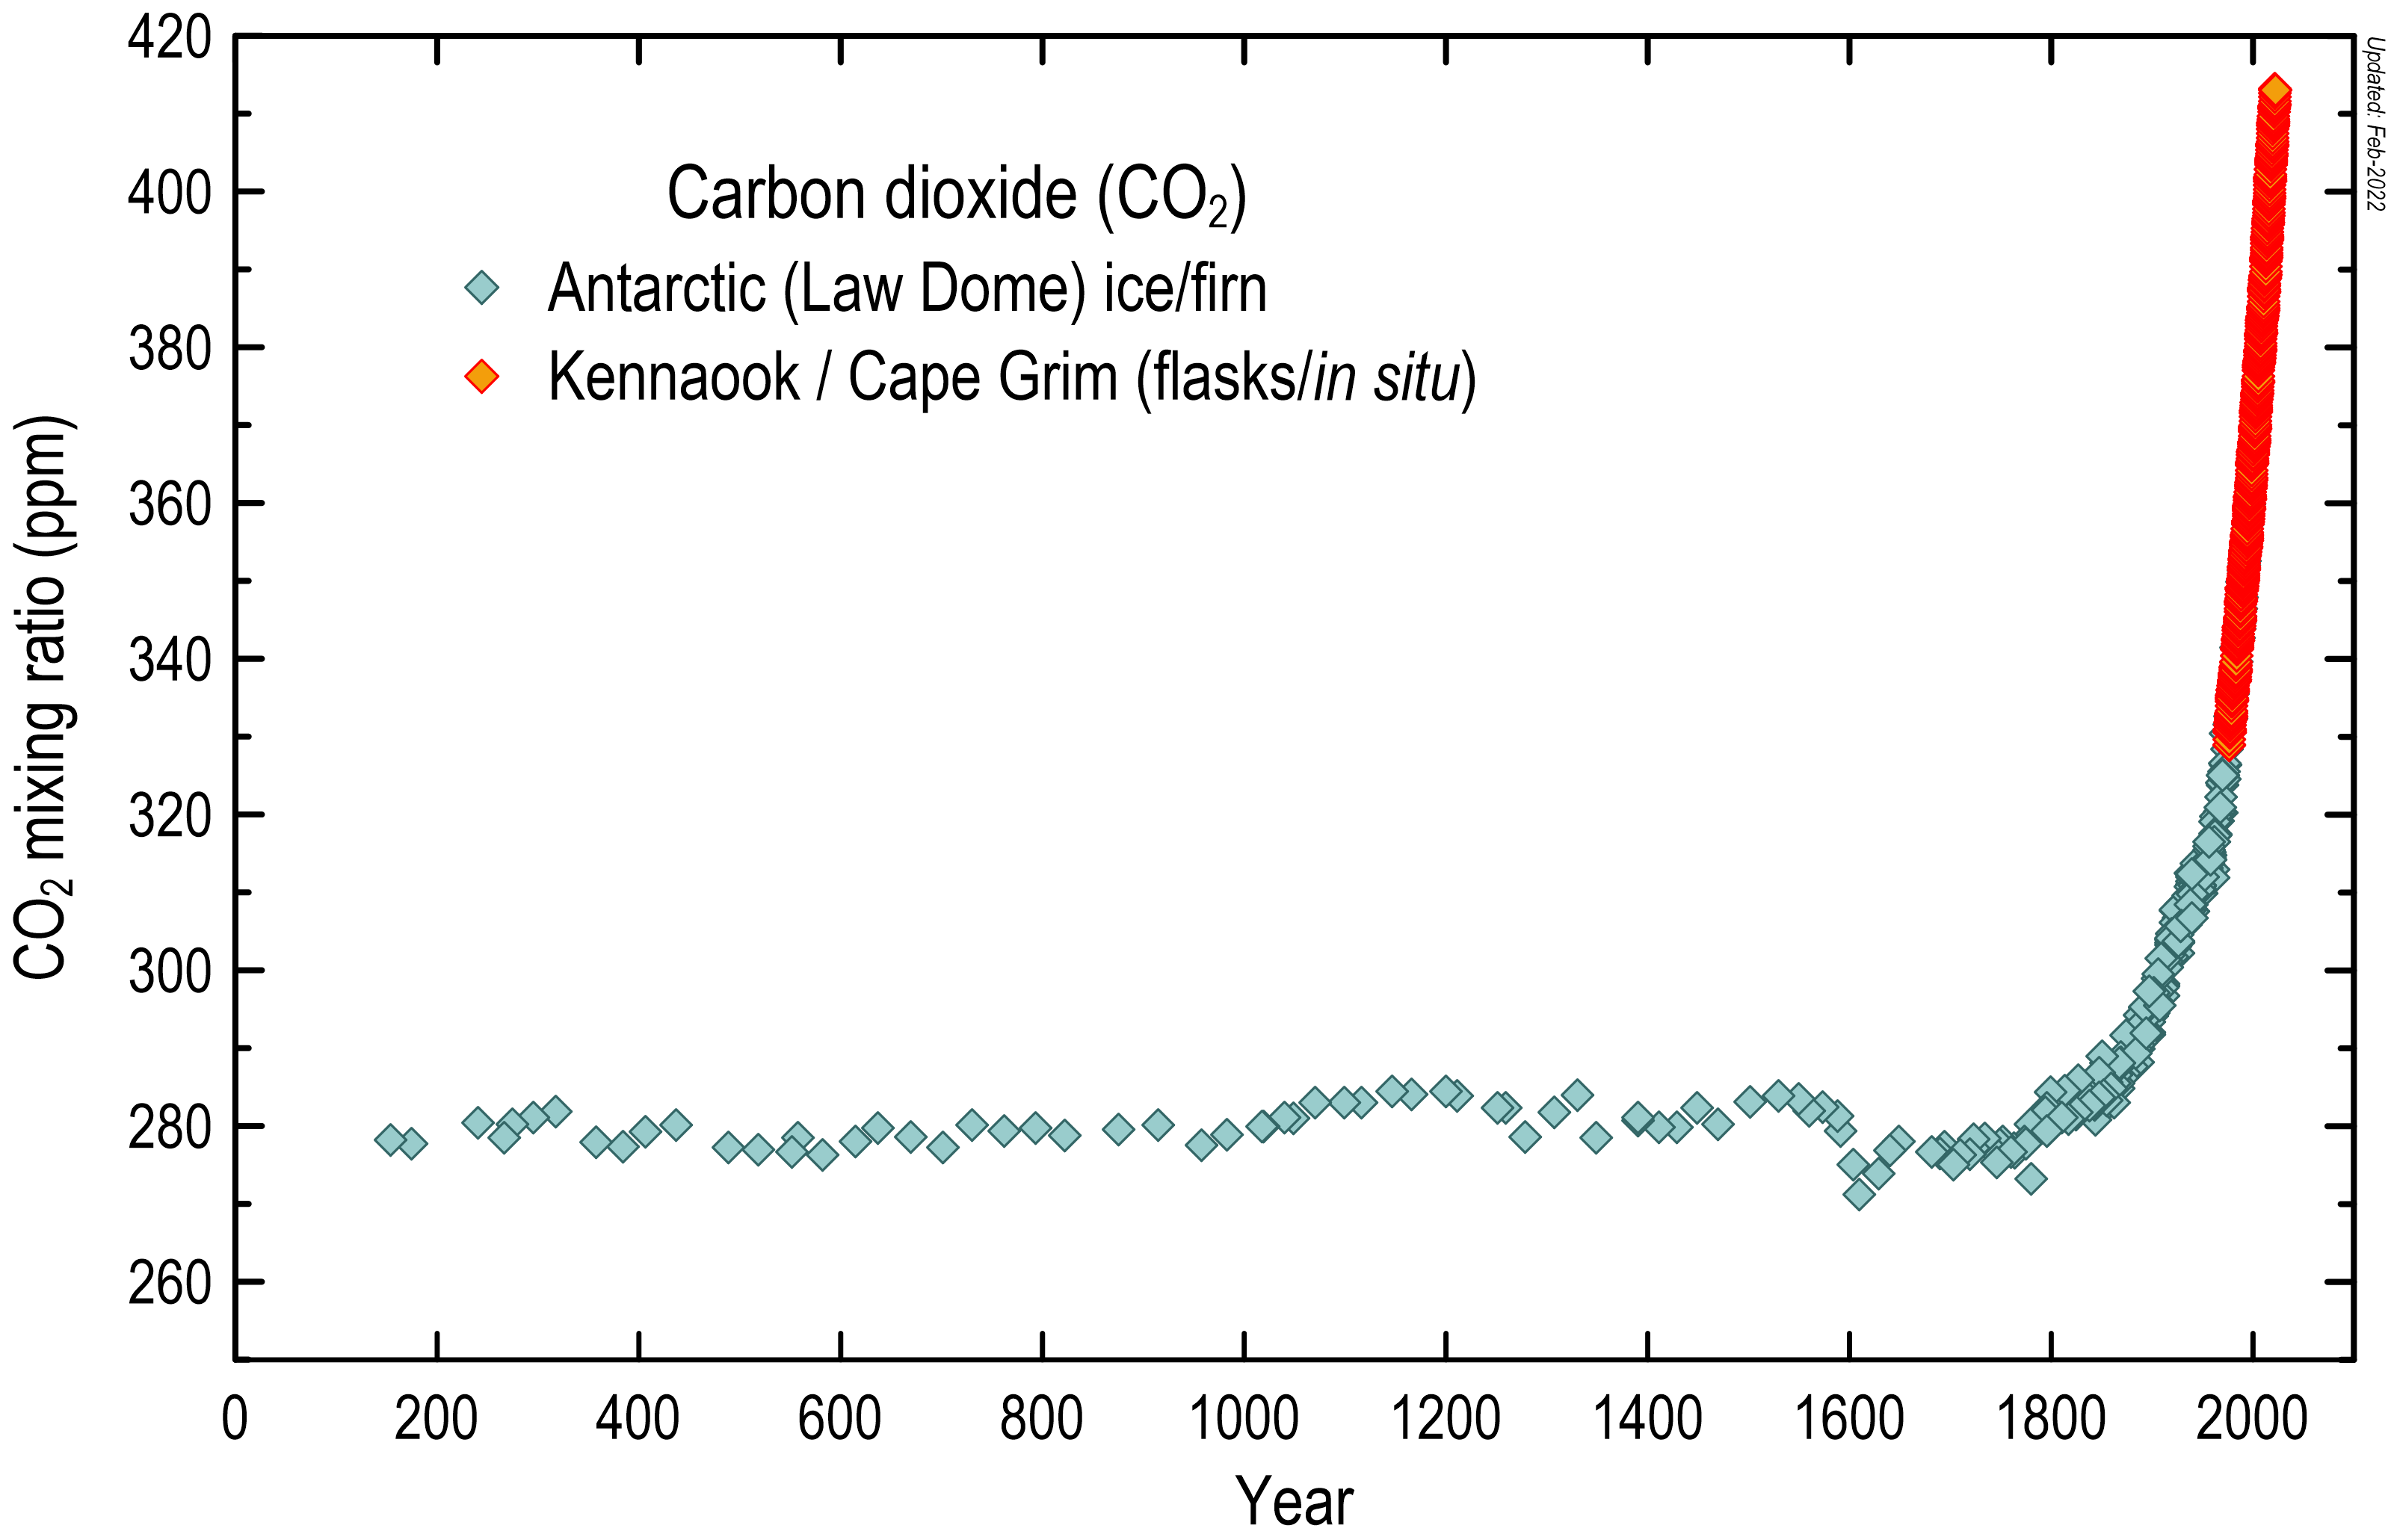 Atmospheric carbon dioxide concentrations in the air were reasonably stable (typically quoted as 278 ppm) before industrialisation (in the timeframe of human existence).
Since industrialisation in the mid-18th century, carbon dioxide concentrations have increased by about 47 per cent, based on measurements from Kennaook / Cape Grim and on air samples collected from Antarctic ice at Law Dome.
Concentrations
Dry air is composed of nitrogen (78 per cent) and oxygen (21 per cent). Other gases, such as argon, carbon dioxide, methane, hydrogen, nitrous oxide etc. make up the remaining 1 per cent.
Carbon dioxide is measured in parts per million molar (ppm). A concentration of 400 ppm carbon dioxide means that if you have a sample of dry air, made up of 1 million molecules, 400 of those would be carbon dioxide.
Methane
Measurement
Methane concentrations in air have been analysed using the CRDS technique since 2013 (as for carbon dioxide).
Prior to that time, methane was measured at Kennaook / Cape Grim using a gas chromatograph (GC) equipped with a flame ionisation detector (FID). The GC separates the air into its various components and the FID uses a hydrogen flame to ionize components such as methane, which are then detected as a disturbance to an applied voltage field.
Comparison to pre-industrial concentrations
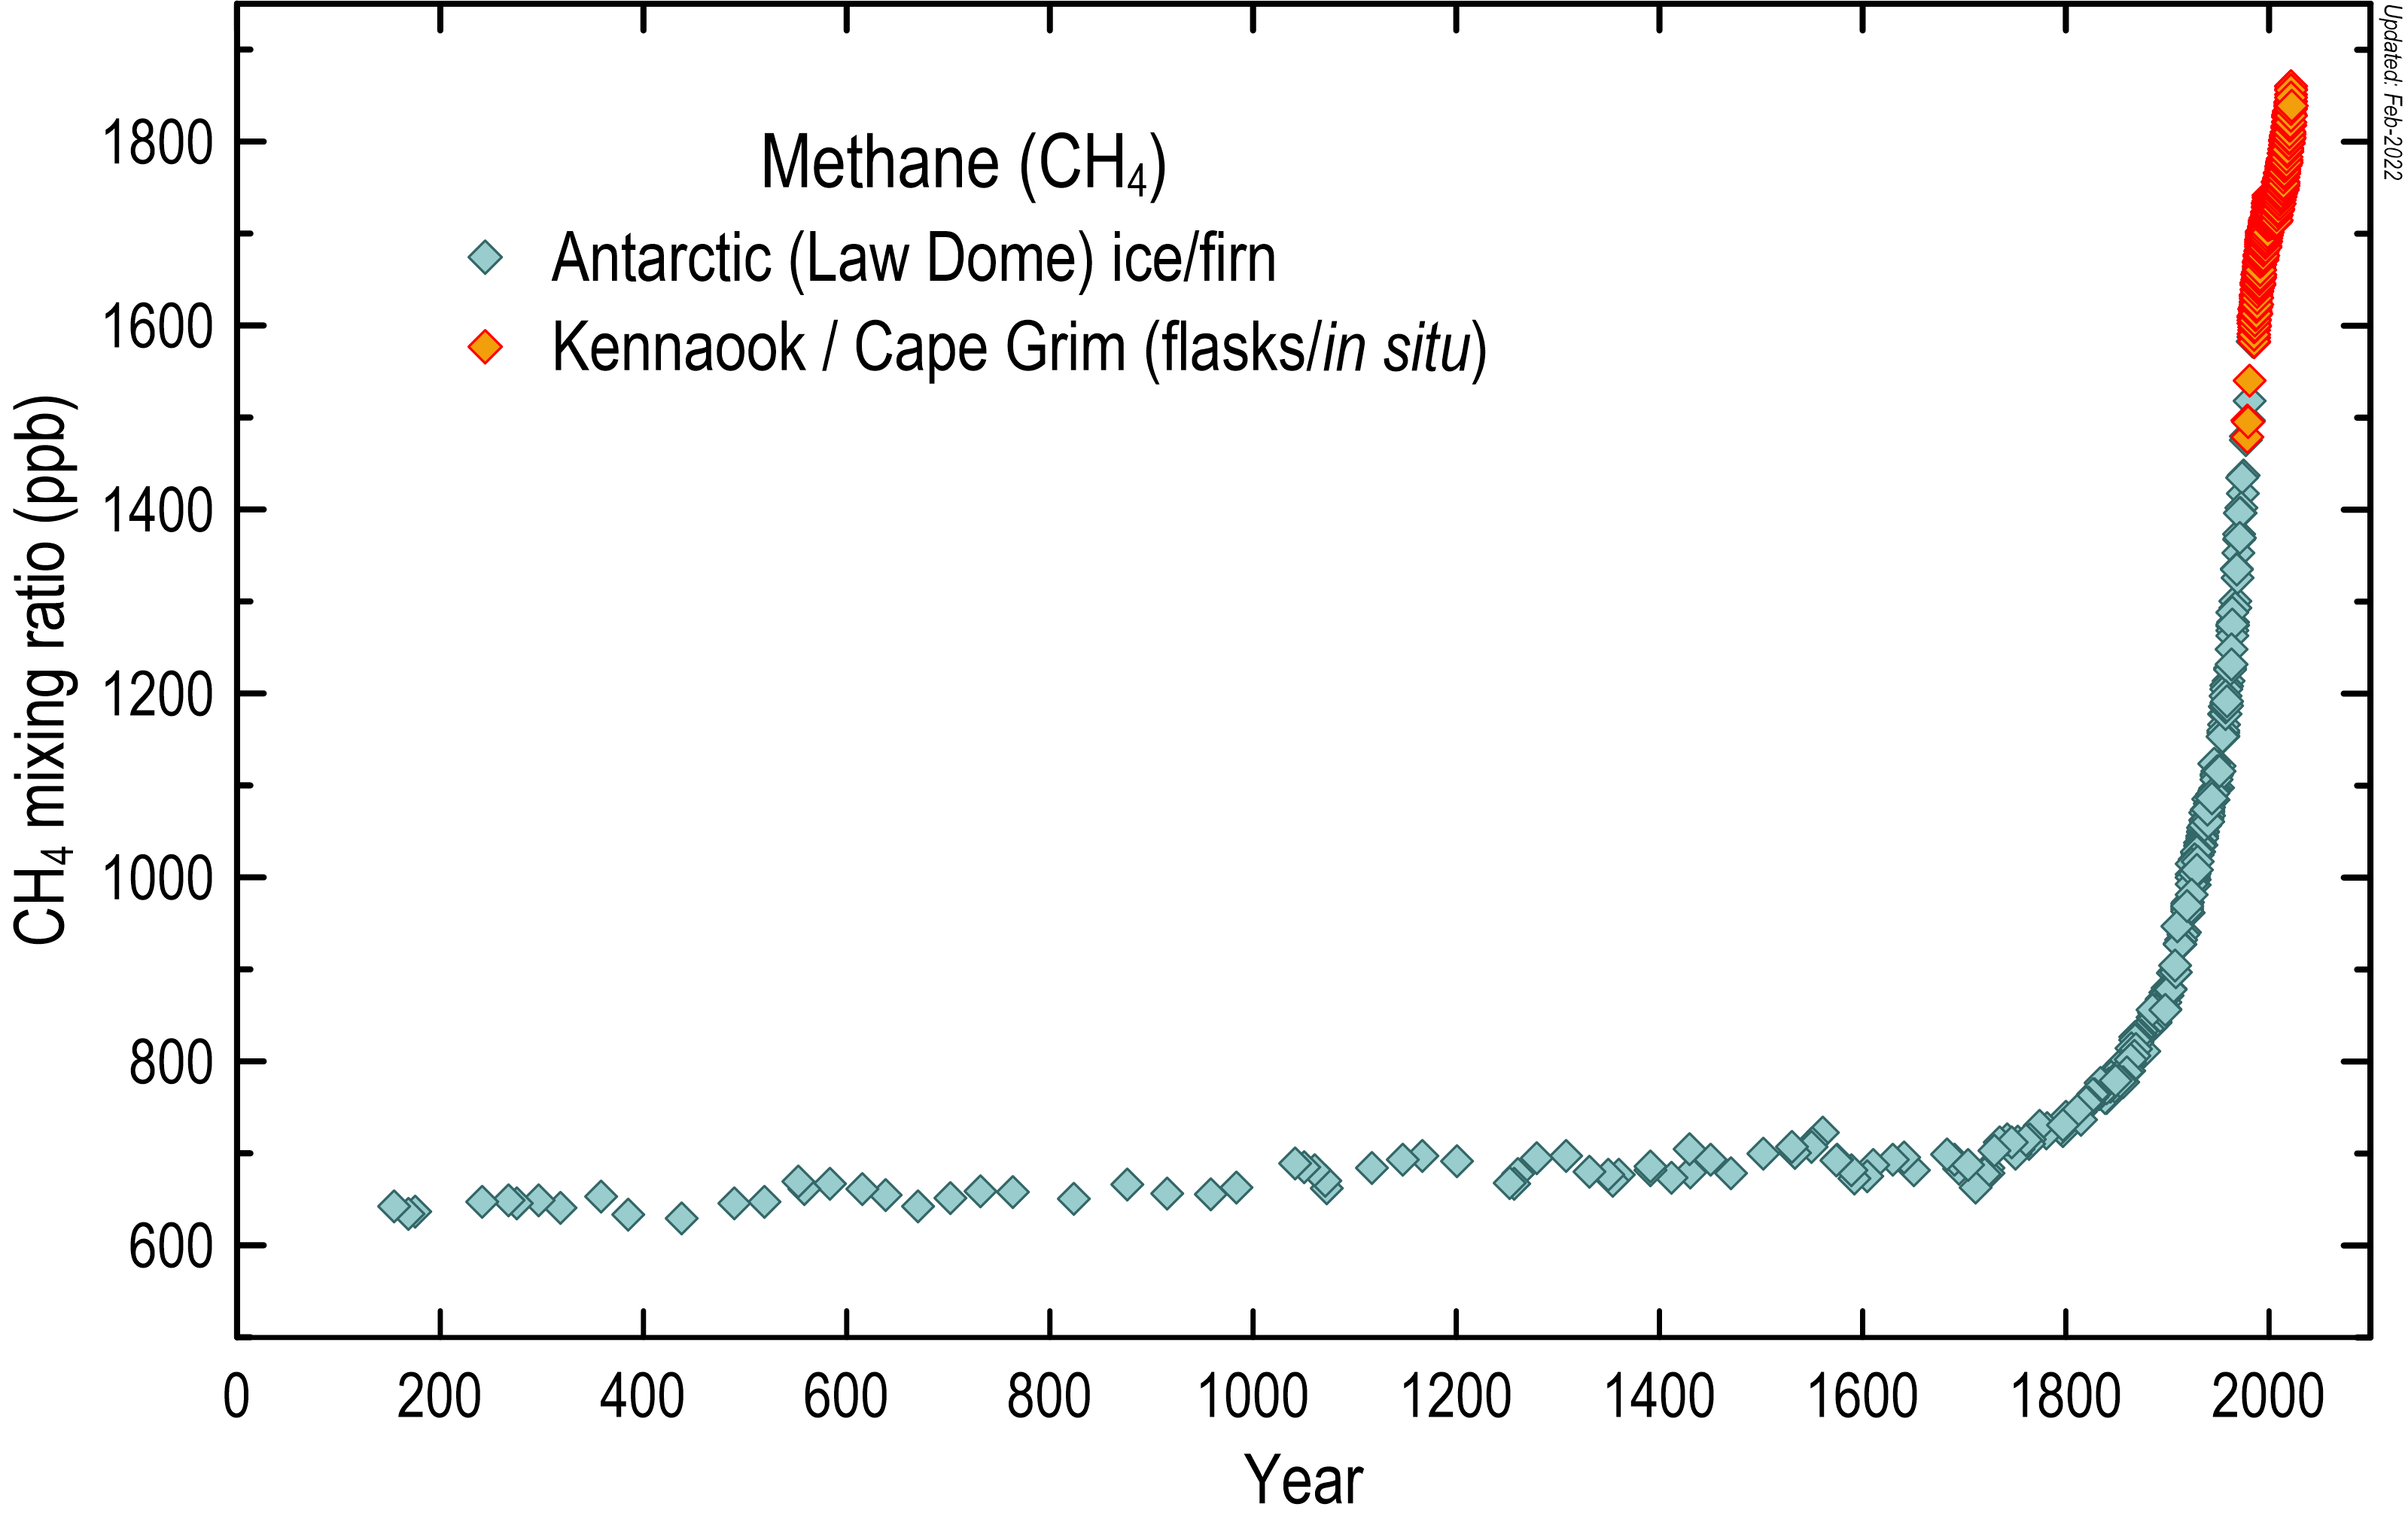
Methane concentrations in the air were reasonably stable before industrialisation (in the timeframe of human existence) typically quoted as 700 ppb (parts per billion molar).
Since industrialisation, methane concentrations have increased by more than 160 per cent to present day values in exceess of 1800 ppb.
Trends
 Methane has increased in the global atmosphere due to a variety of agricultural practices, such as rice and cattle farming, as well as from the mining of coal, the mining and reticulation of natural gas and possibly increased emissions from wetlands in response to global temperature increases.
Seasonal variations
Methane concentrations show seasonal variations (annual cycles) that vary according to global location and altitude. The major processes that contribute to methane annual cycles are:
- release from wetlands, dependant on temperature and rainfall;
- destruction in the atmosphere by hydroxyl radicals;
- transport of methane around the globe from source regions (the Northern Hemisphere is a net source of methane, the Southern Hemisphere a net sink).
The baseline methane data displayed here from Kennaook / Cape Grim show both the annual cycle and the long-term trend.
Inter-annual variability
As with carbon dioxide, there are the more subtle inter-annual variations in methane, which have been shown to correlate with the regular ENSO phenomenon and with major volcanic eruptions. These variations in methane are small compared to the regular annual cycle, but can make a difference to the observed year-by-year annual increase.
Concentrations
Methane is measured in parts per billion molar. A methane concentration of 1800 ppb means that in a sample of dry air containing one billion molecules, 1800 of those would be methane molecules.
Nitrous oxide
Measurement
Nitrous oxide concentrations in air are measured using a GC equipped with an electron capture detector (ECD). Electrons from a radioactive source in the ECD ionize molecules like nitrous oxide, which interfere with the standing current of the detector generated from the ionisation of a carrier gas such as nitrogen and/or argon. The change in current indicates the amount of nitrous oxide in the sample.
We plan to transition our reported Kennaook / Cape Grim in situ nitroux oxide to measurements made with the CRDS technique, consistent with carbon dioxide and methane.
Comparison to pre-industrial concentrations
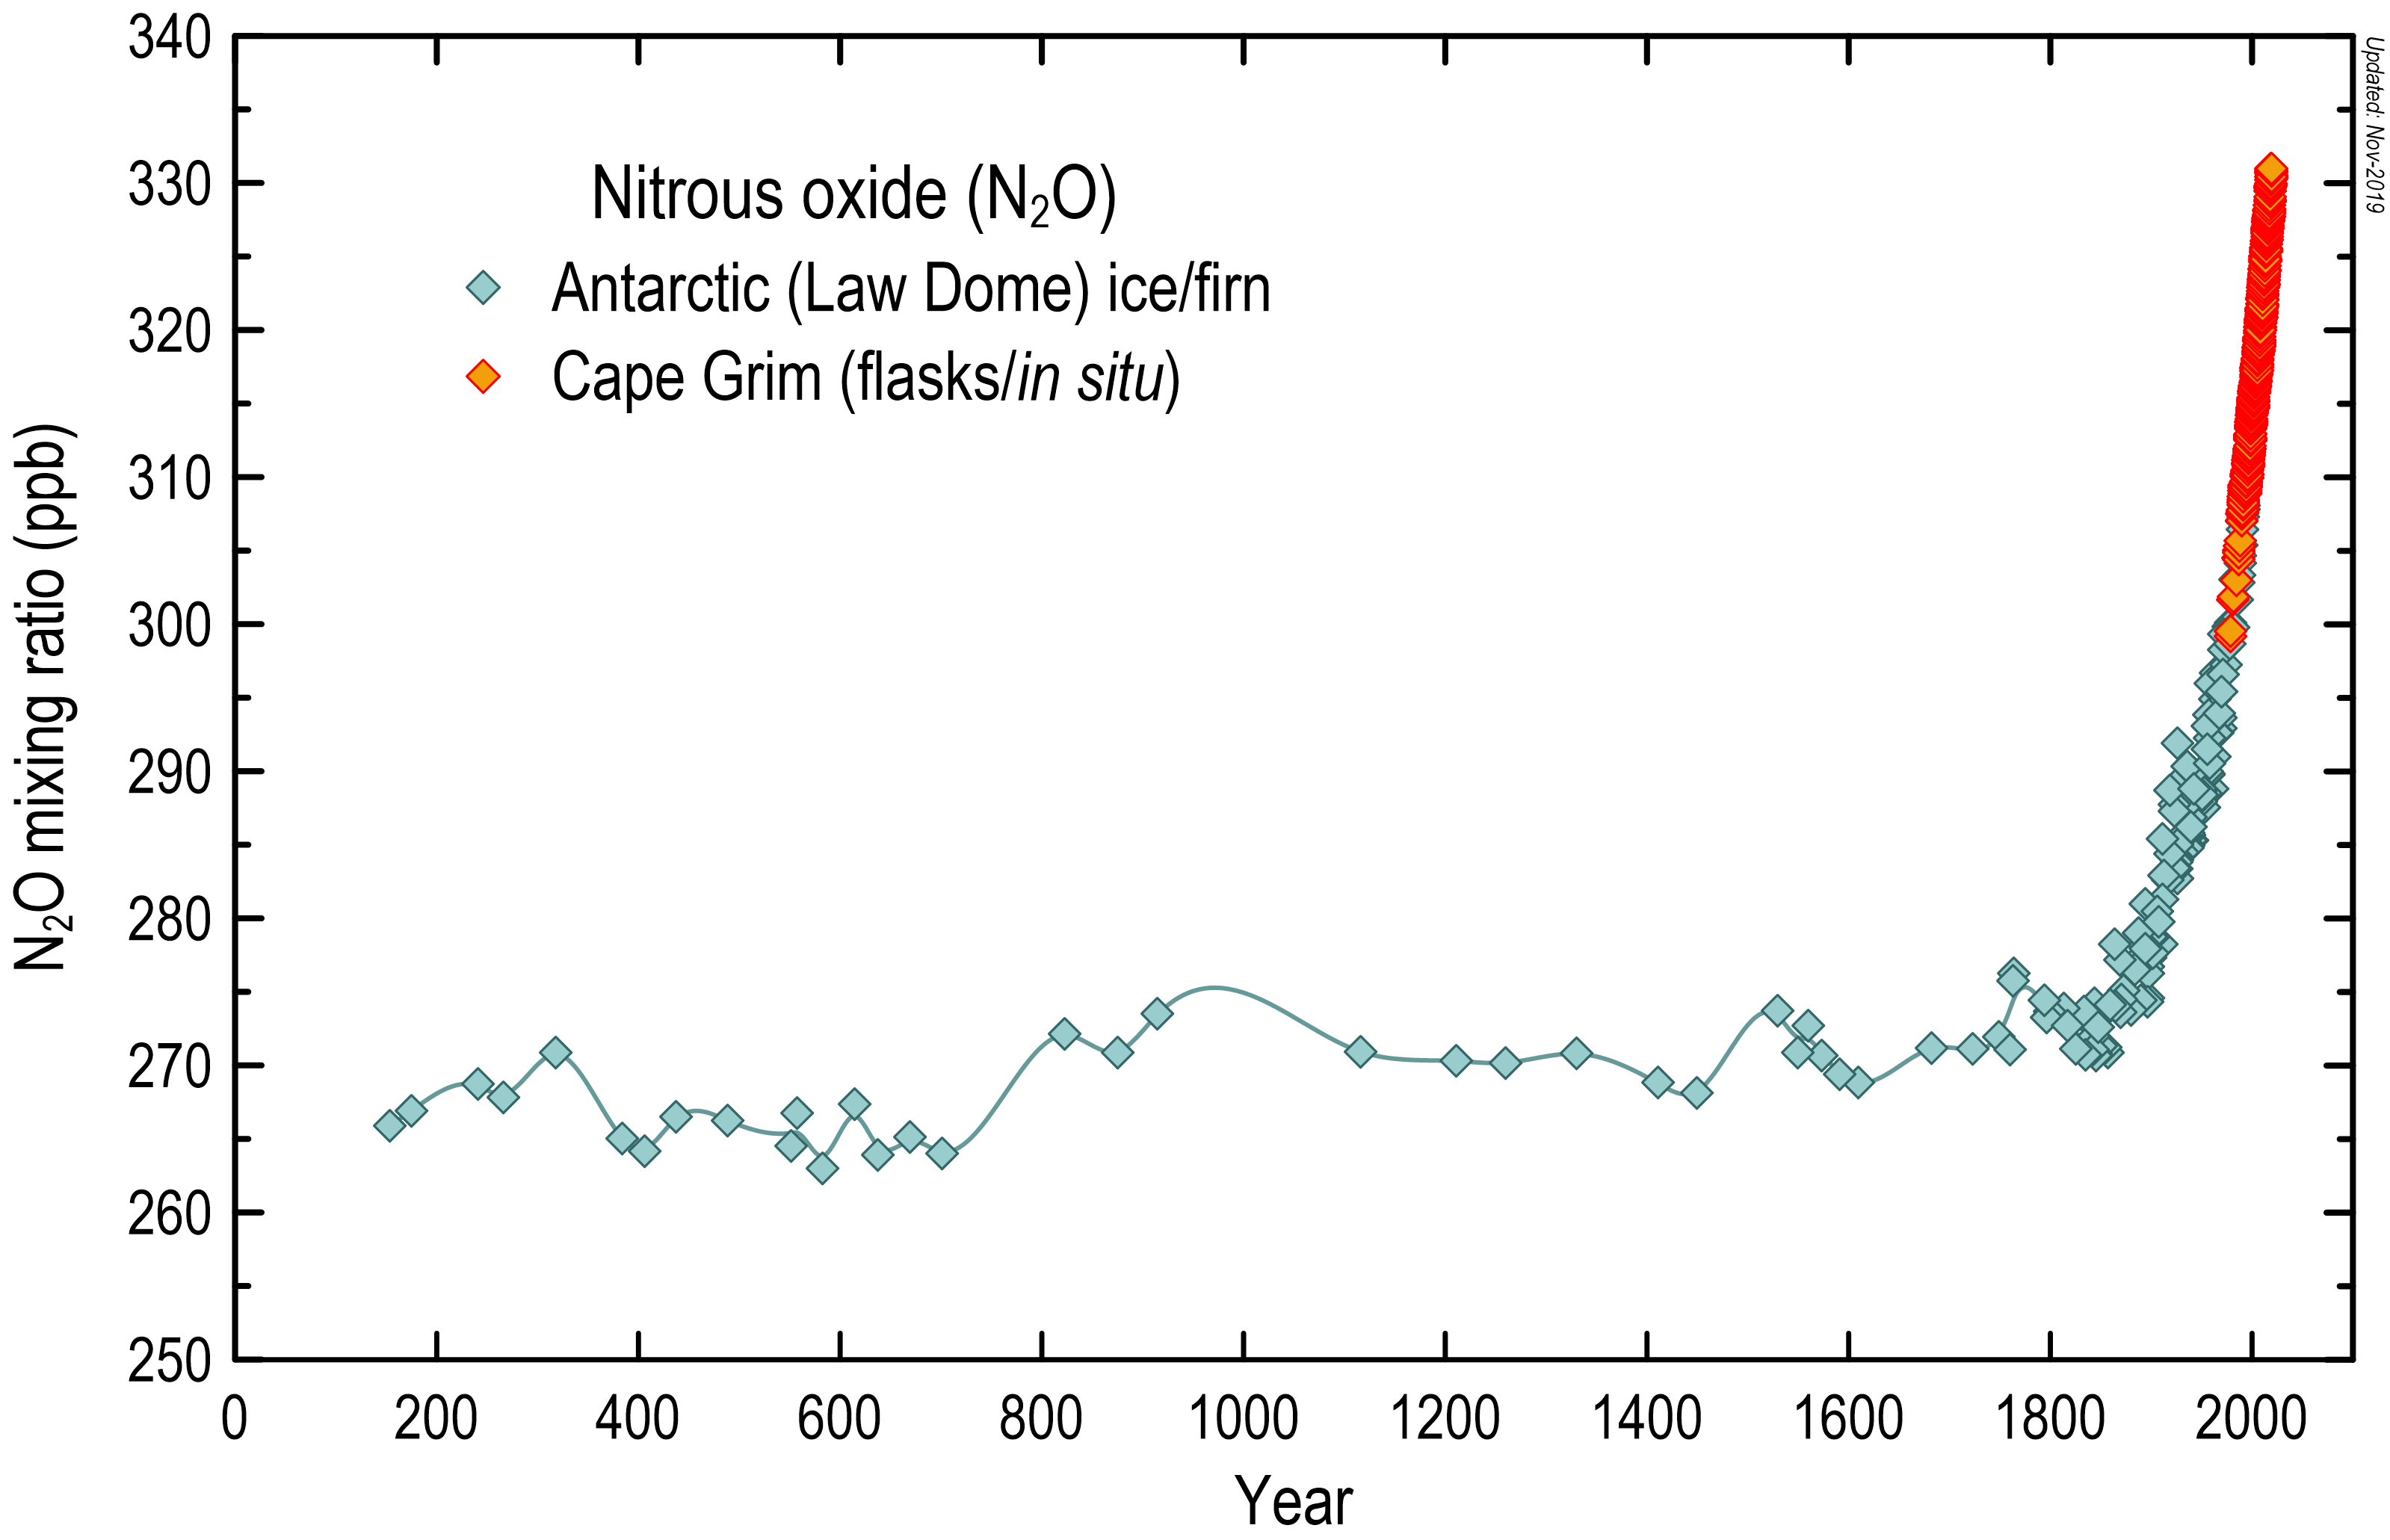
Like carbon dioxide and methane, nitrous oxide concentrations in the air were reasonably stable before industrialisation, and were typically quoted as 270 ppb (parts per billion molar). Since industrialisation, nitrous oxide concentrations have increased by about 22 per cent to present day values, currently around 330 ppb.
Trends
 Nitrous oxide has increased in the global atmosphere due to agricultural and land-use practices, in particular the widespread use of nitrogenous fertilisers.
Seasonal variations
Nitrous oxide concentrations show relatively-weak seasonal variations (annual cycles) that vary according to global location and altitude. The major processes that contribute to nitrous oxide annual cycles include:
- natural, seasonal releases from the ocean;
- exchange of air with the stratosphere where most nitrous oxide is destroyed; and
- transport of nitrous around the globe from source regions (the Northern Hemisphere is a net source of nitrous oxide, the Southern Hemisphere a net sink).
The baseline nitrous oxide data displayed here from Kennaook / Cape Grim show both the annual cycle and the long-term trend.
Concentrations
Nitrous oxide is measured in parts per billion. A concentration of 330 ppb nitrous oxide means that in every billion molecules of dry air, 330 of those would be nitrous oxide.
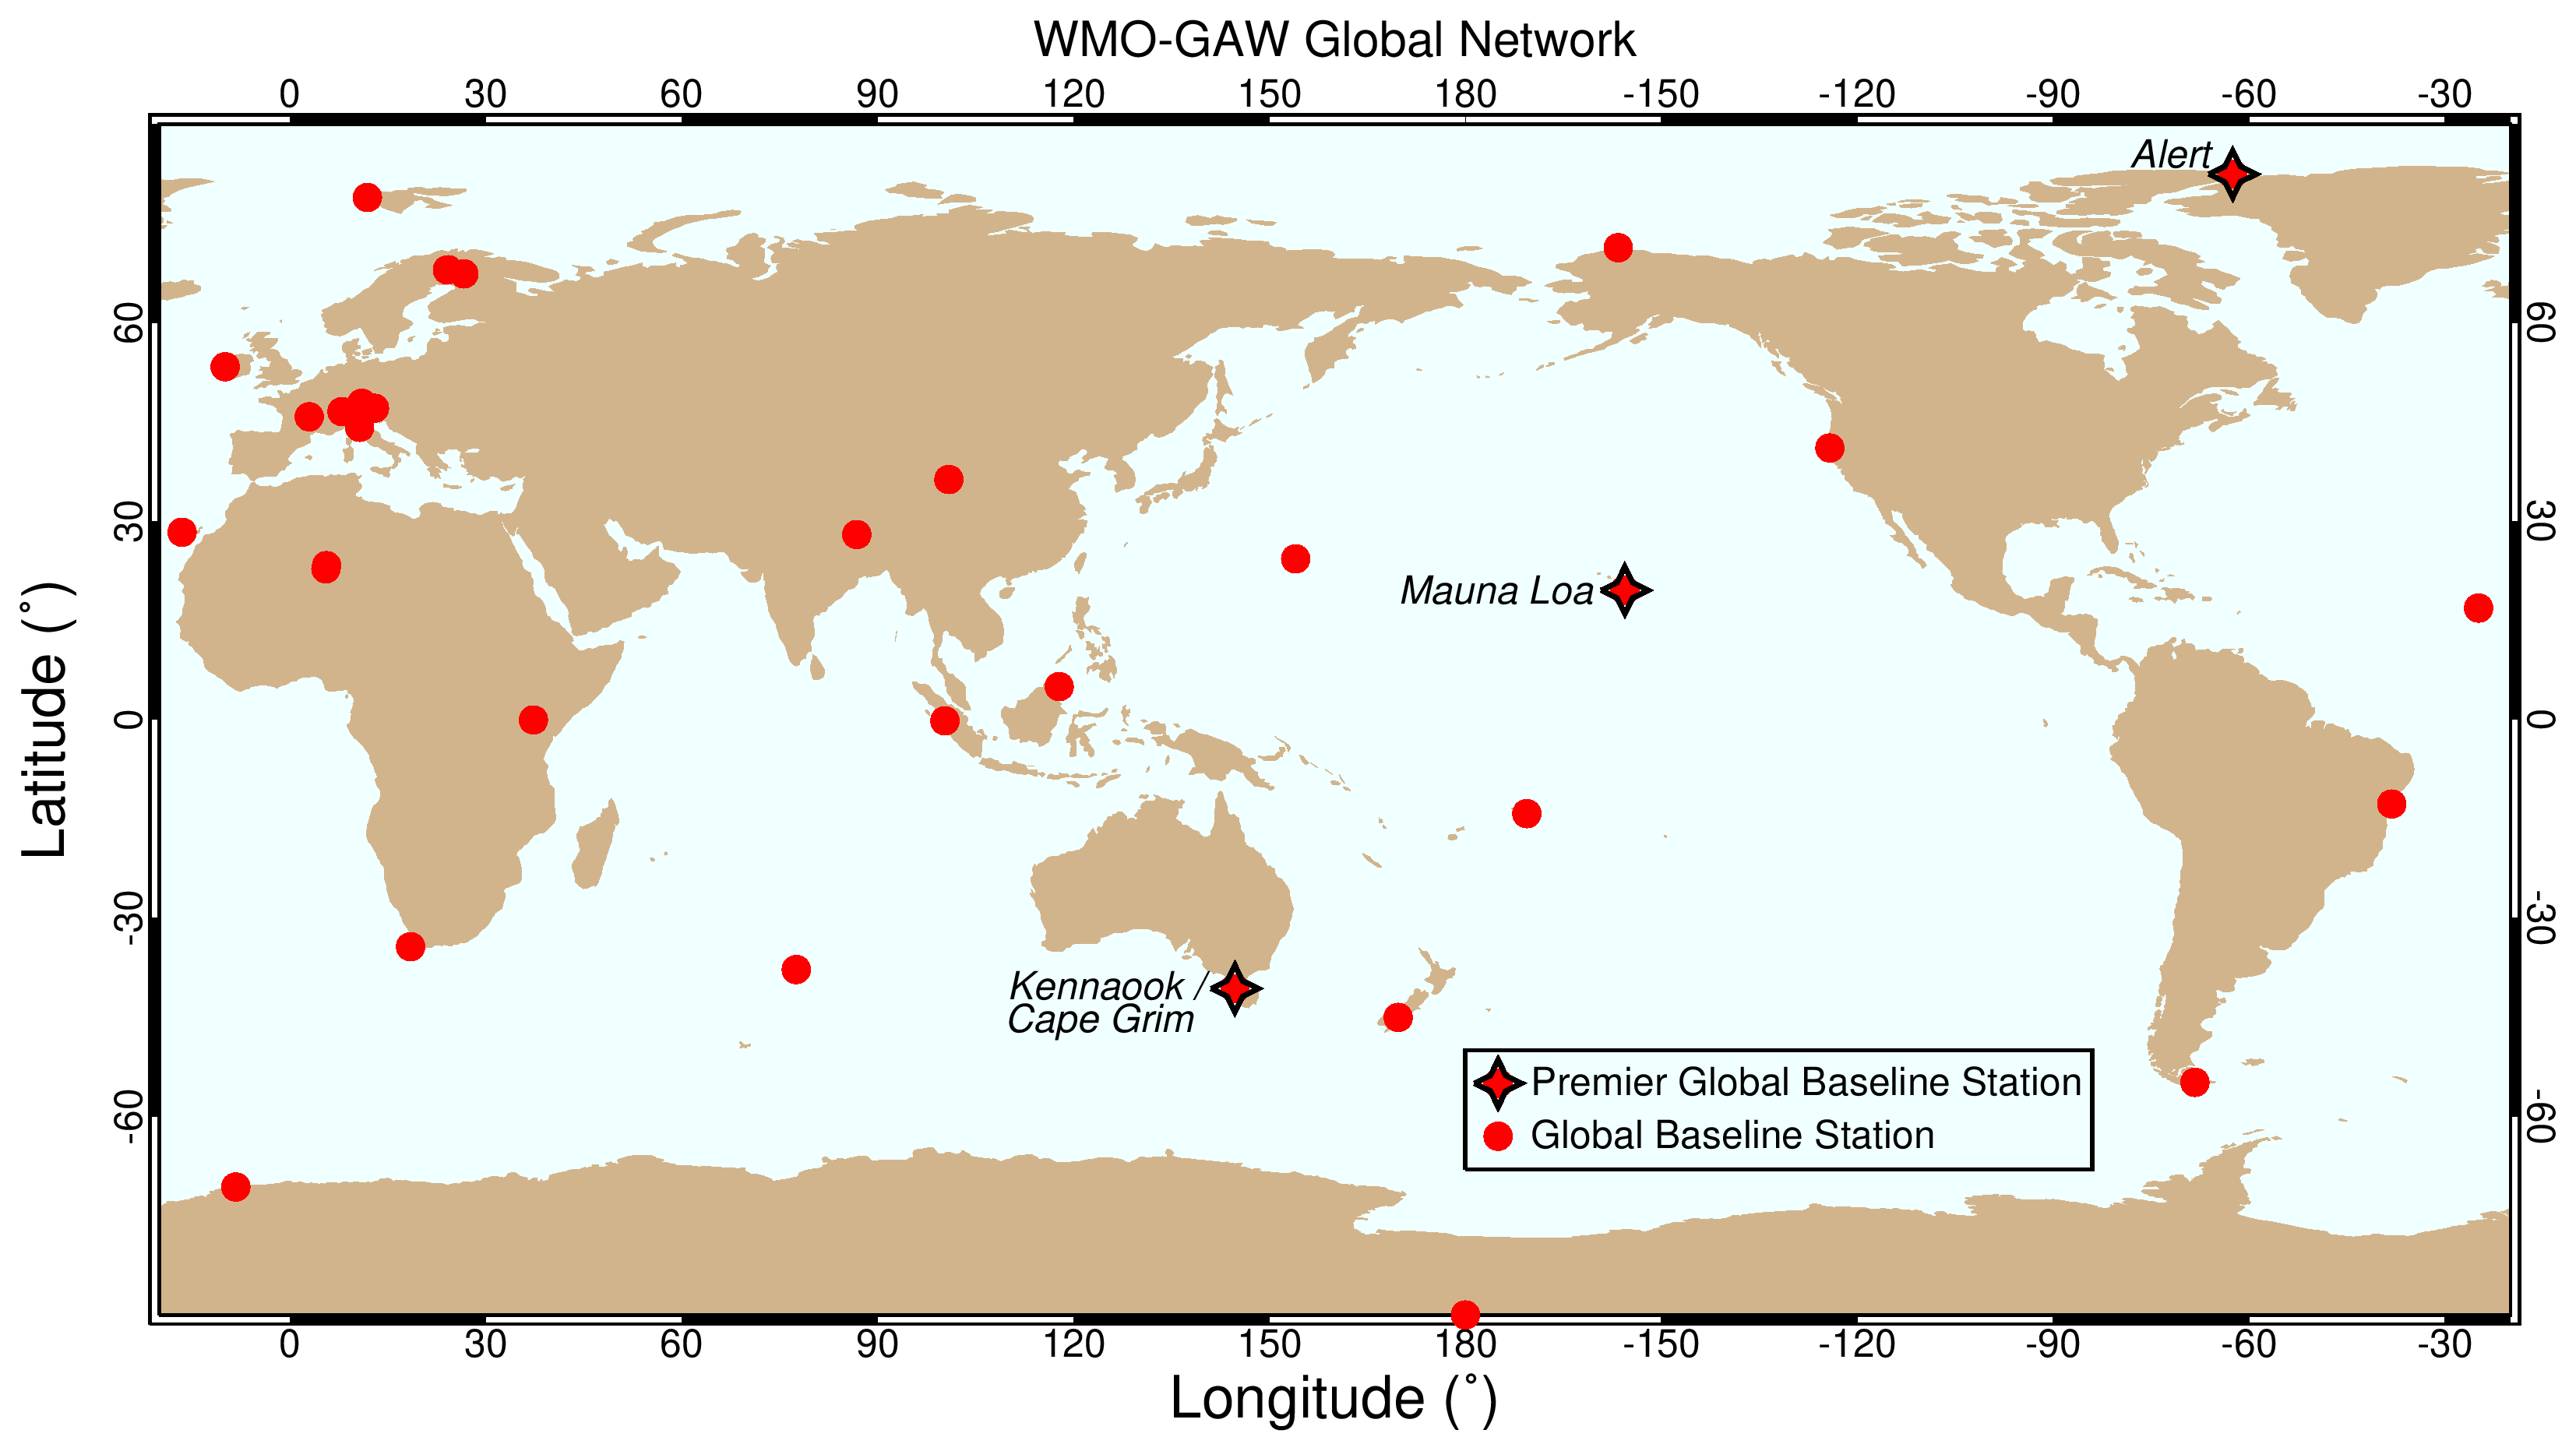
Download the latest Kennaook / Cape Grim Greenhouse Gas data (CSV)
Upper panel
Monthly mean baseline greenhouse gas concentrations measured at the Kennaook / Cape Grim Baseline Air Pollution Station, Tasmania.
Lower panel
Annual (blue bars) and decadal (red horizontal lines) growth rates of greenhouse gases in the atmosphere.
Baseline
In the map below, the clean air or 'baseline' sector for Kennaook / Cape Grim is shown. Air masses arriving at the Kennaook / Cape Grim station from between 190-280 degrees have typically travelled for many thousands of kilometres across the Southern Ocean. This air is free from recent human and terrestrial influences and is very well mixed, meaning it represents the background or 'baseline' atmospheric composition for the mid-latitudes of the Southern Hemisphere. The long-term changes in baseline atmospheric composition are the principal drivers of climate change.
Not all air arriving at Kennaook / Cape Grim comes from the baseline sector. Other wind directions bring air masses that carry the signals from the land surface and human emissions, from cities, agriculture, and other activities.
The data provided here are the baseline data measured at Kennaook / Cape Grim, showing the underlying, and ubiquitous changes occurring in the composition of the atmosphere. Monthly mean data are determined from a smooth curve fit to all the baseline hours measured in a month. Annual mean growth rates of greenhouse gas concentration (ppm/year or ppb/year) are determined by first calculating an annual mean growth rate centred on each month. For example, the annual growth rate centred on January in year n, GR(Jann) is given by the Jul(n–1) – Jul(n) monthly mean concentrations; GR(Febn) = Aug((n–1) – Aug(n) … GR(Juln) = Jan(n) – Jan(n+1) … GR(Decn) = Jun(n) – Jun(n+1). Finally, the mean of those twelve growth rate values is reported for each year as the annual mean growth rate. Decadal means are calculated from the annual means for each decade.
History
In 1798, the steep, forbidding, black rocks forming the north-west cape of Tasmania led Matthew Flinders to name the location Cape Grim, as he circumnavigated the island. However, long before Flinders bestowed his European name, the Peerapper people called the area Kennaook. We now call the observatory Kennaook / Cape Grim Baseline Air Pollution Station.
The Kennaook / Cape Grim program originated from a commitment by the Australian Government to the United Nations Environment Program in the early 1970s to monitor and study global atmospheric composition for climate change purposes. As a result, the Kennaook / Cape Grim Baseline Air Pollution Station (KCG BAPS) first began measuring the composition of the atmosphere in April 1976 and has been in continuous operation since that date.
Kennaook / Cape Grim is a joint responsibility of the Bureau of Meteorology (BoM) and the Commonwealth Scientific and Industrial Research Organisation (CSIRO). The BoM funds and operates the CG BAPS. CSIRO is responsible for the quality of the data and provides analysis, interpretation and modelling of the results. All data are made available to interested parties – Australian government agencies, industry, the public and international agencies.
Kennaook / Cape Grim data are more valuable than ever in understanding how our atmosphere is changing, as we track progress towards the goals of the Paris Agreement.
What is measured?
The composition of the air arriving at Kennaook / Cape Grim is analysed to determine concentrations of more than 80 different greenhouse gases (GHGs), including carbon dioxide (CO2), methane (CH4), nitrous oxide (N2O) and synthetic GHGs such as hydrofluorocarbons (HFCs), perfluorocarbons (PFCs) and sulfur hexafluoride (SF6). Many of the most potent GHGs are also ozone depleting substances (such as the chlorofluorocarbons (CFCs) and halons).
Air pollutants including natural and anthropogenic aerosols (particles such as sea salt, mineral dust and black carbon) and reactive gases are also measured along with weather and climate indicators like wind speed and direction, rainfall, temperature, humidity and solar radiation.
The Australian Nuclear Science and Technology Organisation (ANSTO) also contributes to the atmospheric composition program, measuring the naturally occurring radioactive gas 222Radon.
| Formula/Acronym | Gases |
|---|---|
| CO2 | carbon dioxide |
| CH4 | methane |
| N2O | nitrous oxide |
| CFC | chlorofluorocarbon |
| HFC | hydrofluorocarbon |
| PFC | perfluorocarbon |
| SF6 | sulfur hexafluoride |
| ODS | ozone depleting substances |
| GHG | greenhouse gas |
Some of the air samples collected at Kennaook / Cape Grim have been archived for further analyses as required. The Cape Grim Air Archive commenced in 1978 and is invaluable in determining the past atmospheric composition of a wide range of gases. For some of these gases, accurate and precise analytical methods have only recently evolved (for example HFCs and PFCs).
The measurements are state-of-the-art in precision and accuracy. They are used to identify trace gas trends in the Southern Hemisphere, which in turn can be used to drive climate change models. They are also helping to identify processes that influence further atmospheric composition change, and predict how the climate will change under different scenarios of future GHG loading.
Changes in the air
Most GHGs (for example carbon dioxide, nitrous oxide, HFCs, PFCs, sulfur hexafluoride) have shown continuous increases in concentration since the mid-to-late 1970s. However, those GHGs which are also ozone depleting substances such as the CFCs are now in decline. This is owing to a ban on their production under the Montreal Protocol that was developed to protect the stratospheric ozone layer.
Since the station first began measurements in 1976, carbon dioxide levels have increased by almost 25 per cent.
Concentrations of methane and nitrous oxide at Cape Grim have also increased significantly since 1978 by about 24 and 10 per cent respectively.
These increases are principally caused by human activities such as fossil fuel consumption and various agricultural practices.
Carbon dioxide
Measurement
Carbon dioxide concentrations in air masses have been measured using a technique called cavity ring-down spectroscopy (CRDS) since 2013. These instruments can detect the concentration of carbon dioxide by measuring the amount infrared laser light absorbed by an air sample compared to a reference or calibration air sample.
Prior to 2013, Non-Dispersive Infrared (NDIR) gas analysers were used to measure carbon dioxide. These instruments operate in a similar way to the more modern CRDS instruments, but require more onerous calibration regimes to account for drift and non-linearity.
Carbon dioxide can also be measured using a gas chromatograph (GC), by first converting the carbon dioxide to methane, and then measuring the methane with a flame ionisation detector (FID) (see below).
Seasonal variation
Carbon dioxide concentrations show seasonal variations (annual cycles) that vary according to global location and altitude. Several processes contribute to carbon dioxide annual cycles: for example, uptake and release of carbon dioxide by terrestrial plants and the oceans, and the transport of carbon dioxide around the globe from source regions (the Northern Hemisphere is a net source of carbon dioxide, the Southern Hemisphere a net sink).
The Kennaook / Cape Grim baseline carbon dioxide data displayed show both the annual cycle and the long-term trend.
Inter-annual variability
As well as the obvious seasonal variations and long-term trends in carbon dioxide concentrations, there are also more subtle variations, which have been shown to correlate significantly with the regular El Niño-Southern Oscillation (ENSO) phenomenon and with major volcanic eruptions. These variations in carbon dioxide are small compared to the regular annual cycle, but can make a difference to the observed year-by-year increase in carbon dioxide.
Comparison to pre-industrial concentrations
Atmospheric carbon dioxide concentrations in the air were reasonably stable (typically quoted as 278 ppm) before industrialisation (in the timeframe of human existence).
Atmospheric carbon dioxide concentrations (in ppm) over the last 2000 years, based on measurements of air trapped in Antarctic ice and firn (the compacted snow layer that eventually forms solid ice), shown in blue-grey diamonds, and the modern Cape Grim in situ record, shown in orange.
Since industrialisation in the mid-18th century, carbon dioxide concentrations have increased by about 47 per cent, based on measurements from Kennaook / Cape Grim and on air samples collected from Antarctic ice at Law Dome.
Concentrations
Dry air is composed of nitrogen (78 per cent) and oxygen (21 per cent). Other gases, such as argon, carbon dioxide, methane, hydrogen, nitrous oxide etc. make up the remaining 1 per cent.
Carbon dioxide is measured in parts per million molar (ppm). A concentration of 400 ppm carbon dioxide means that if you have a sample of dry air, made up of 1 million molecules, 400 of those would be carbon dioxide.
Methane
Measurement
Methane concentrations in air have been analysed using the CRDS technique since 2013 (as for carbon dioxide).
Prior to that time, methane was measured at Kennaook / Cape Grim using a gas chromatograph (GC) equipped with a flame ionisation detector (FID). The GC separates the air into its various components and the FID uses a hydrogen flame to ionize components such as methane, which are then detected as a disturbance to an applied voltage field.
Comparison to pre-industrial concentrations
Methane concentrations in the air were reasonably stable before industrialisation (in the timeframe of human existence) typically quoted as 700 ppb (parts per billion molar).
Since industrialisation, methane concentrations have increased by more than 160 per cent to present day values in exceess of 1800 ppb.
Trends
Methane has increased in the global atmosphere due to a variety of agricultural practices, such as rice and cattle farming, as well as from the mining of coal, the mining and reticulation of natural gas and possibly increased emissions from wetlands in response to global temperature increases.
Atmospheric methane concentrations (in ppb) over the last 2000 years, based on measurements of air trapped in Antarctic ice and firn, shown in blue-grey diamonds, and the modern Cape Grim in situ record, shown in orange.
Seasonal variations
Methane concentrations show seasonal variations (annual cycles) that vary according to global location and altitude. The major processes that contribute to methane annual cycles are:
- release from wetlands, dependant on temperature and rainfall;
- destruction in the atmosphere by hydroxyl radicals;
- transport of methane around the globe from source regions (the Northern Hemisphere is a net source of methane, the Southern Hemisphere a net sink).
The baseline methane data displayed here from Kennaook / Cape Grim show both the annual cycle and the long-term trend.
Inter-annual variability
As with carbon dioxide, there are the more subtle inter-annual variations in methane, which have been shown to correlate with the regular ENSO phenomenon and with major volcanic eruptions. These variations in methane are small compared to the regular annual cycle, but can make a difference to the observed year-by-year annual increase.
Concentrations
Methane is measured in parts per billion molar. A methane concentration of 1800 ppb means that in a sample of dry air containing one billion molecules, 1800 of those would be methane molecules.
Nitrous oxide
Measurement
Nitrous oxide concentrations in air are measured using a GC equipped with an electron capture detector (ECD). Electrons from a radioactive source in the ECD ionize molecules like nitrous oxide, which interfere with the standing current of the detector generated from the ionisation of a carrier gas such as nitrogen and/or argon. The change in current indicates the amount of nitrous oxide in the sample.
We plan to transition our reported Kennaook / Cape Grim in situ nitroux oxide to measurements made with the CRDS technique, consistent with carbon dioxide and methane.
Comparison to pre-industrial concentrations
Like carbon dioxide and methane, nitrous oxide concentrations in the air were reasonably stable before industrialisation, and were typically quoted as 270 ppb (parts per billion molar). Since industrialisation, nitrous oxide concentrations have increased by about 22 per cent to present day values, currently around 330 ppb.
Trends
Nitrous oxide has increased in the global atmosphere due to agricultural and land-use practices, in particular the widespread use of nitrogenous fertilisers.
Atmospheric nitrous oxide concentrations (in ppb) over the last 2000 years, based on measurements of air trapped in Antarctic ice and firn, shown in blue-grey diamonds, and the modern Cape Grim in situ record, shown in orange.
Seasonal variations
Nitrous oxide concentrations show relatively-weak seasonal variations (annual cycles) that vary according to global location and altitude. The major processes that contribute to nitrous oxide annual cycles include:
- natural, seasonal releases from the ocean;
- exchange of air with the stratosphere where most nitrous oxide is destroyed; and
- transport of nitrous around the globe from source regions (the Northern Hemisphere is a net source of nitrous oxide, the Southern Hemisphere a net sink).
The baseline nitrous oxide data displayed here from Kennaook / Cape Grim show both the annual cycle and the long-term trend.
Concentrations
Nitrous oxide is measured in parts per billion. A concentration of 330 ppb nitrous oxide means that in every billion molecules of dry air, 330 of those would be nitrous oxide.
